
This is the time of year when I look back at my reading and how well I did with my goals, with some pretty graphs. (Yes, I am that kind of geek.)
2018 Overview
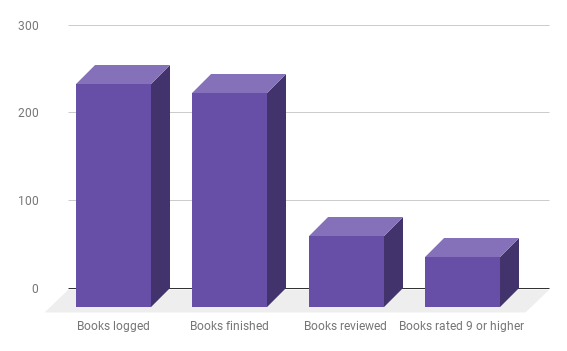
I logged 254 books this year, finished 244, reviewed 81, and rated 58 9 or above. I was up a little from last year both in books read and reviewed, even if I still can’t write reviews as fast as I read the books.
How I read
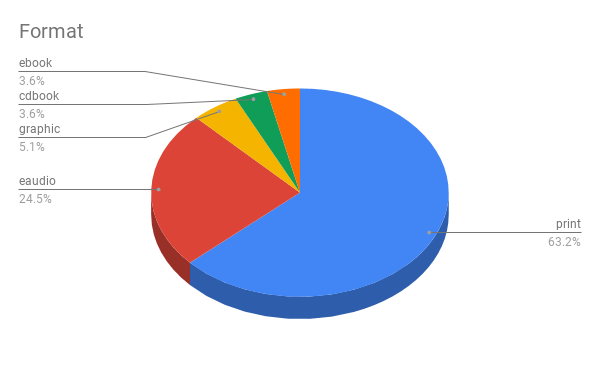
No real surprises here. Even though we’ve been listening to Lord of the Rings on cd, it’s so long that it’s not affecting the numbers here that go by titles, not hours.
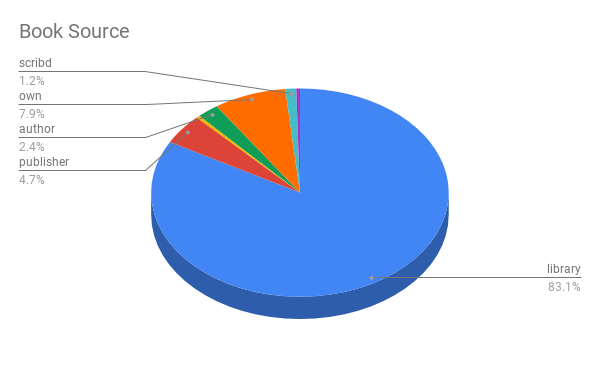
I’m still mostly a library reader.
What I Read
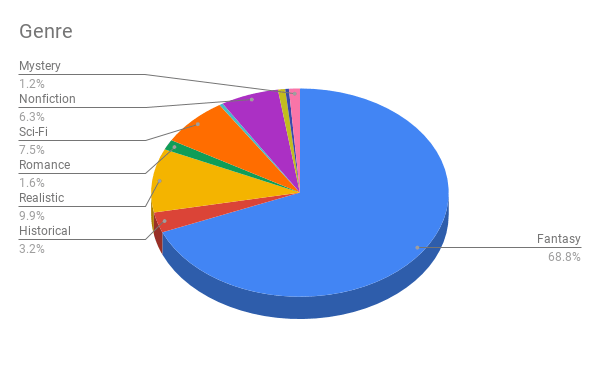
Fantasy is my genre… with Realistic Fiction just edging out Sci-Fi for second highest percentage.
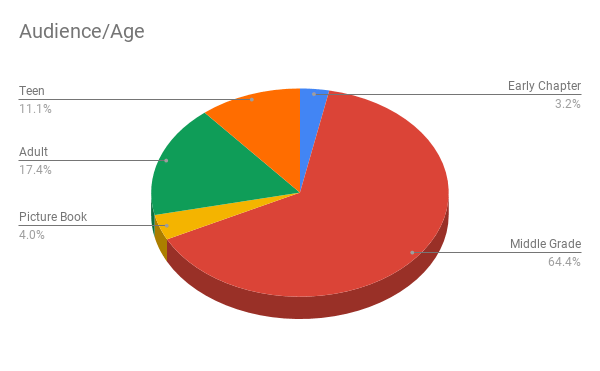
Still reading mostly middle grade… but with a noticeable decrease in teen books from last year.
The Authors
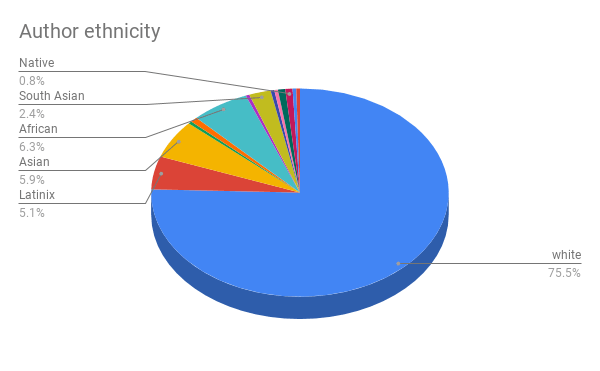
I came super close to my goal of having 25% of my reading be authors of color! Even if it still seems crazy that it’s a challenge to do even that.
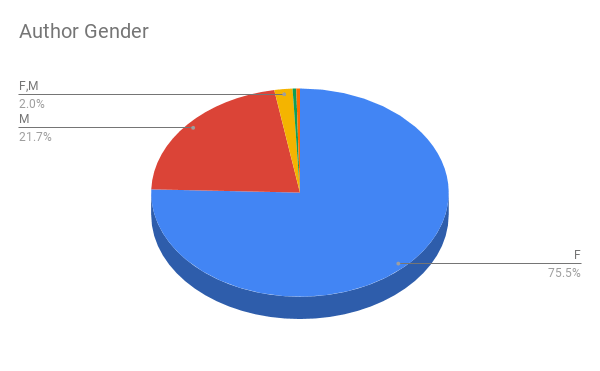
I really don’t feel pressure to read more men.
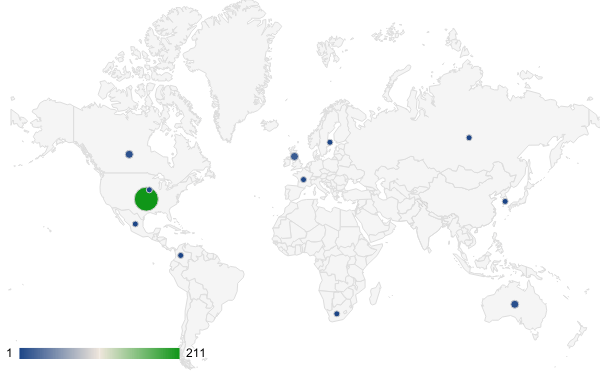
I could work on reading more authors from other countries. But how cool is it that Google will make me a map like this??
The Characters
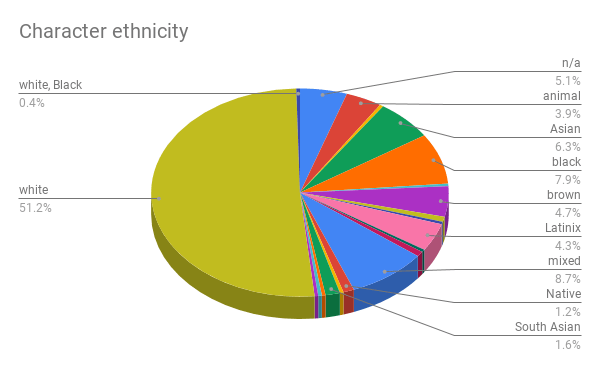
This is noticeably more diverse than last year’s reading! Note that my “mixed” tag includes both multiracial characters and stories where the POV alternates between characters of different ethnicity.
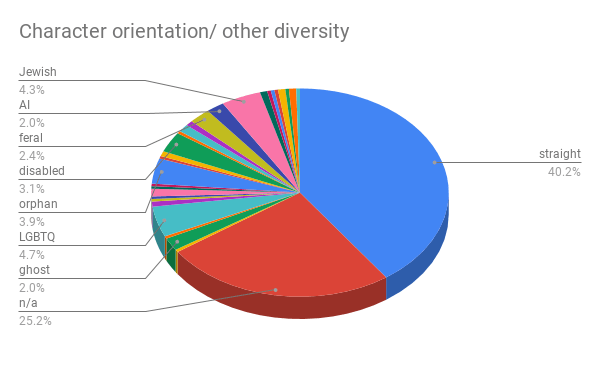
This is trying to track other diversity, which started as looking for LGBTQ characters and has expanded somewhat. N/A is a large percentage partly because I read so much middle grade, where there’s often not even a crush to give a hint as to preference. Hopefully as more middle grade LGBTQ literature is published, I can improve my numbers here! I was so amused that ghosts and AIs made up a significant proportion of my stats this year!
I’ve been doing these graphs for a few years now – here they are from 2017, 2016, 2015, and 2014. As always, if you know of any books that seem up my alley – specifically the middle grade and/or fantasy alley – that would help me round things out as far as LGBTQ, Native authors, and authors outside the US or UK, please do let me know!


I think it’s so cool that you took the time to make these graphs and then share them with your audience.
Thank you very much! It’s part of why I like to track my reading in my own spreadsheets rather than Goodreads – it makes doing these so much easier.
Pingback: 2019 in Review: the Numbers | alibrarymama
Pingback: 2020 In Review – by the Numbers | alibrarymama
Pingback: 2021 In Review – by the Numbers | alibrarymama
Pingback: 2022 In Review – by the Numbers | alibrarymama
Pingback: 2023 In Review – by the Numbers | alibrarymama
Pingback: 2024 In Review – by the Numbers | alibrarymama
Pingback: 2025 In Review – by the Numbers | alibrarymama